The Notepad and Visualize Heuristics Rikard Edgren
I was at Nordic Testing Days and had a great time meeting new and old friends. During my presentation about serendipity I showed two heuristics I wanted to share here as well. They both concern observing from different angles, to learn something new, and increase chances of serendipity.
The Notepad Heuristic
Years ago I worked with translations, and once we translated software that wasn’t fully internationalized. Some parts needed to be changed in binary files; meaning we should take great care that the string length was exactly the same.
Maybe this is why I now and then open many kinds of files in a text editor. In the start of image files, you can see which format it actually is, you can search for password strings, and above all, you might learn something new that will be useful.
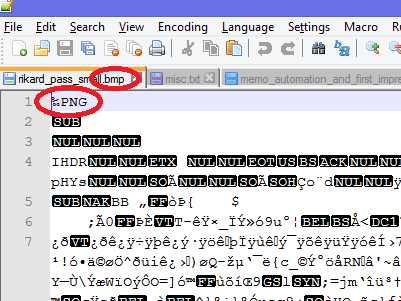
.bmp has png content…
Works wonders for text files as well, and it’s as fast as you can expect from a quicktest:
The Notepad Heuristic – open any file in a text editor, to see and learn more.
Visualize Heuristic
I worked several years for a company producing software for interactive data analysis. We used our software internally, e.g. by looking at the bug system or log files visually. This is not only fun, it also can show you things and it suggests areas to learn even more about.
Not that long ago, we tested an application that calculated driving times and risk coverage for fires in Sweden. It was a huge database with numbers, so we had a look at the data visually, where it showed Sweden with colored dots. We could see that there were holes in the data for a couple of municipalities, which was something we knew we were looking for. But when filtering for bigger fire risks, we found something we didn’t know we were looking for, a squared pattern that in no way can be correct (underlying data had to be rebuilt.)
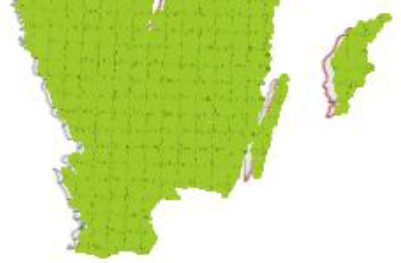
fire risk data is skewed…
This is a good serendipity example, you look for something, but you find something else that is valuable.
Visualize Heuristic – look at data visually, to see patterns, trends and outliers.
[…] The Notepad and Visualize Heuristics – Rikard Edgren – http://thetesteye.com/blog/2014/06/the-notepad-and-visualize-heuristics/ […]